The dashboard is the web app of the registry. In the dashboard, you read outcomes, browse the playbook, and make review decisions. Open the address of your registry in a browser. The dashboard and the service use the same address.
Sign in
If your organization configured sign-in, each page asks you to sign in with your organization account. Click Sign in. Then follow the steps from your identity provider. If the dashboard opens without a sign-in request, sign-in is not configured. See Configure the registry.
Find your way around


The top bar has three destinations, from left to right:
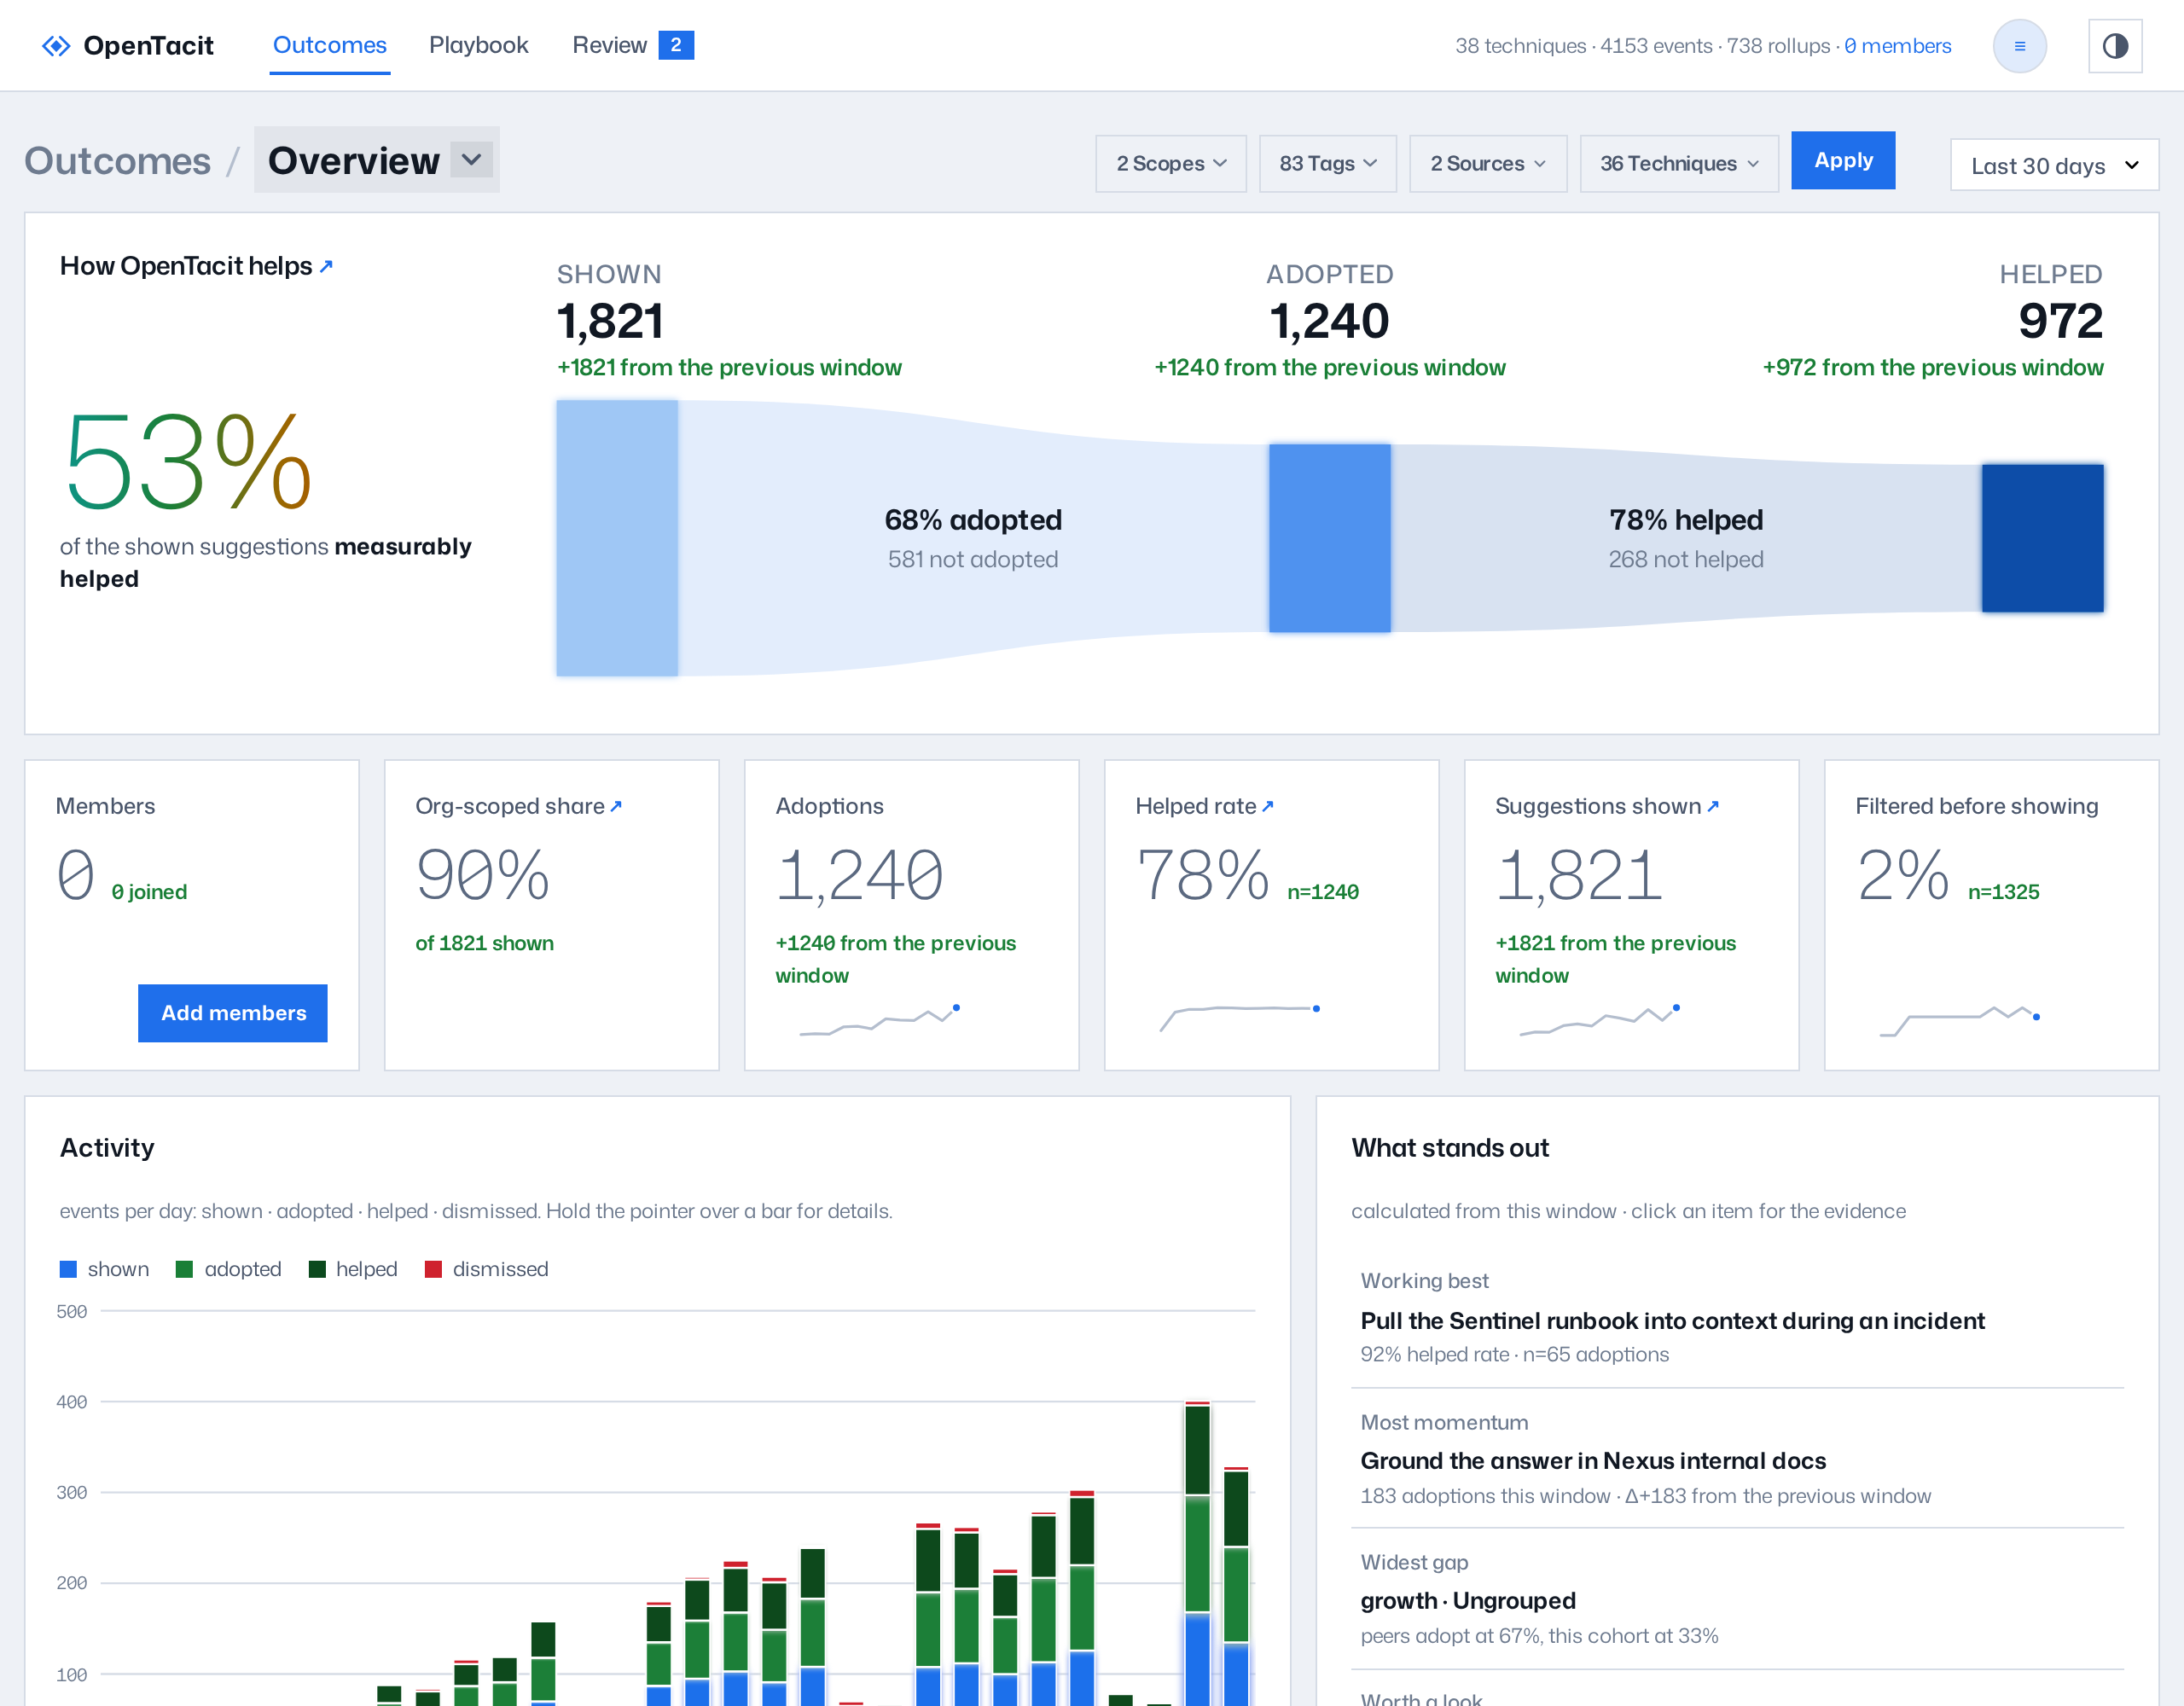
- Outcomes — the landing page. It shows if the playbook helps. It shows the funnel, the trends, and the most important results. See Explore outcomes.
- Playbook — the library. It shows what your organization knows. It opens on the playbook map. See Browse the playbook.
- Review — the queue of decisions. A badge on Review counts the drafts that wait. A warning badge counts the techniques that decay. See Review drafts and flagged techniques.
The account button is at the right end of the bar. It opens a menu with these items:
- Your personal Usage view
- The operator destinations: Learning readiness, Federation, Members, and Settings
- The documentation: User Guide and Development
- Connect your tools
- Sign out
Breadcrumbs below the bar show your position. On Outcomes and Playbook pages, the last breadcrumb is a menu. This menu changes between the views of that section.
Work the pages
Some controls operate the same on all pages:
- Filter box — type in the Filter field in the top bar. The rows on the screen decrease immediately to the rows that match. The dashboard hides the field on pages that have no rows to filter.
- Sortable tables — click a column heading to sort the table. Click the heading again to reverse the order. Click a third time to go back to the initial order.
- Rows are links — click a table row to open the detail page of that row.
- Time window — pages that show measurements have the same period selector: Last 7 days, Last 30 days, Last 90 days, or All time. Your selection stays when you move to a different page.
- Filters with chips — list pages have filter menus for scope, tags, and source. Each filter that you apply becomes a chip. To remove one filter, click its chip. To remove all filters, click the Clear link.
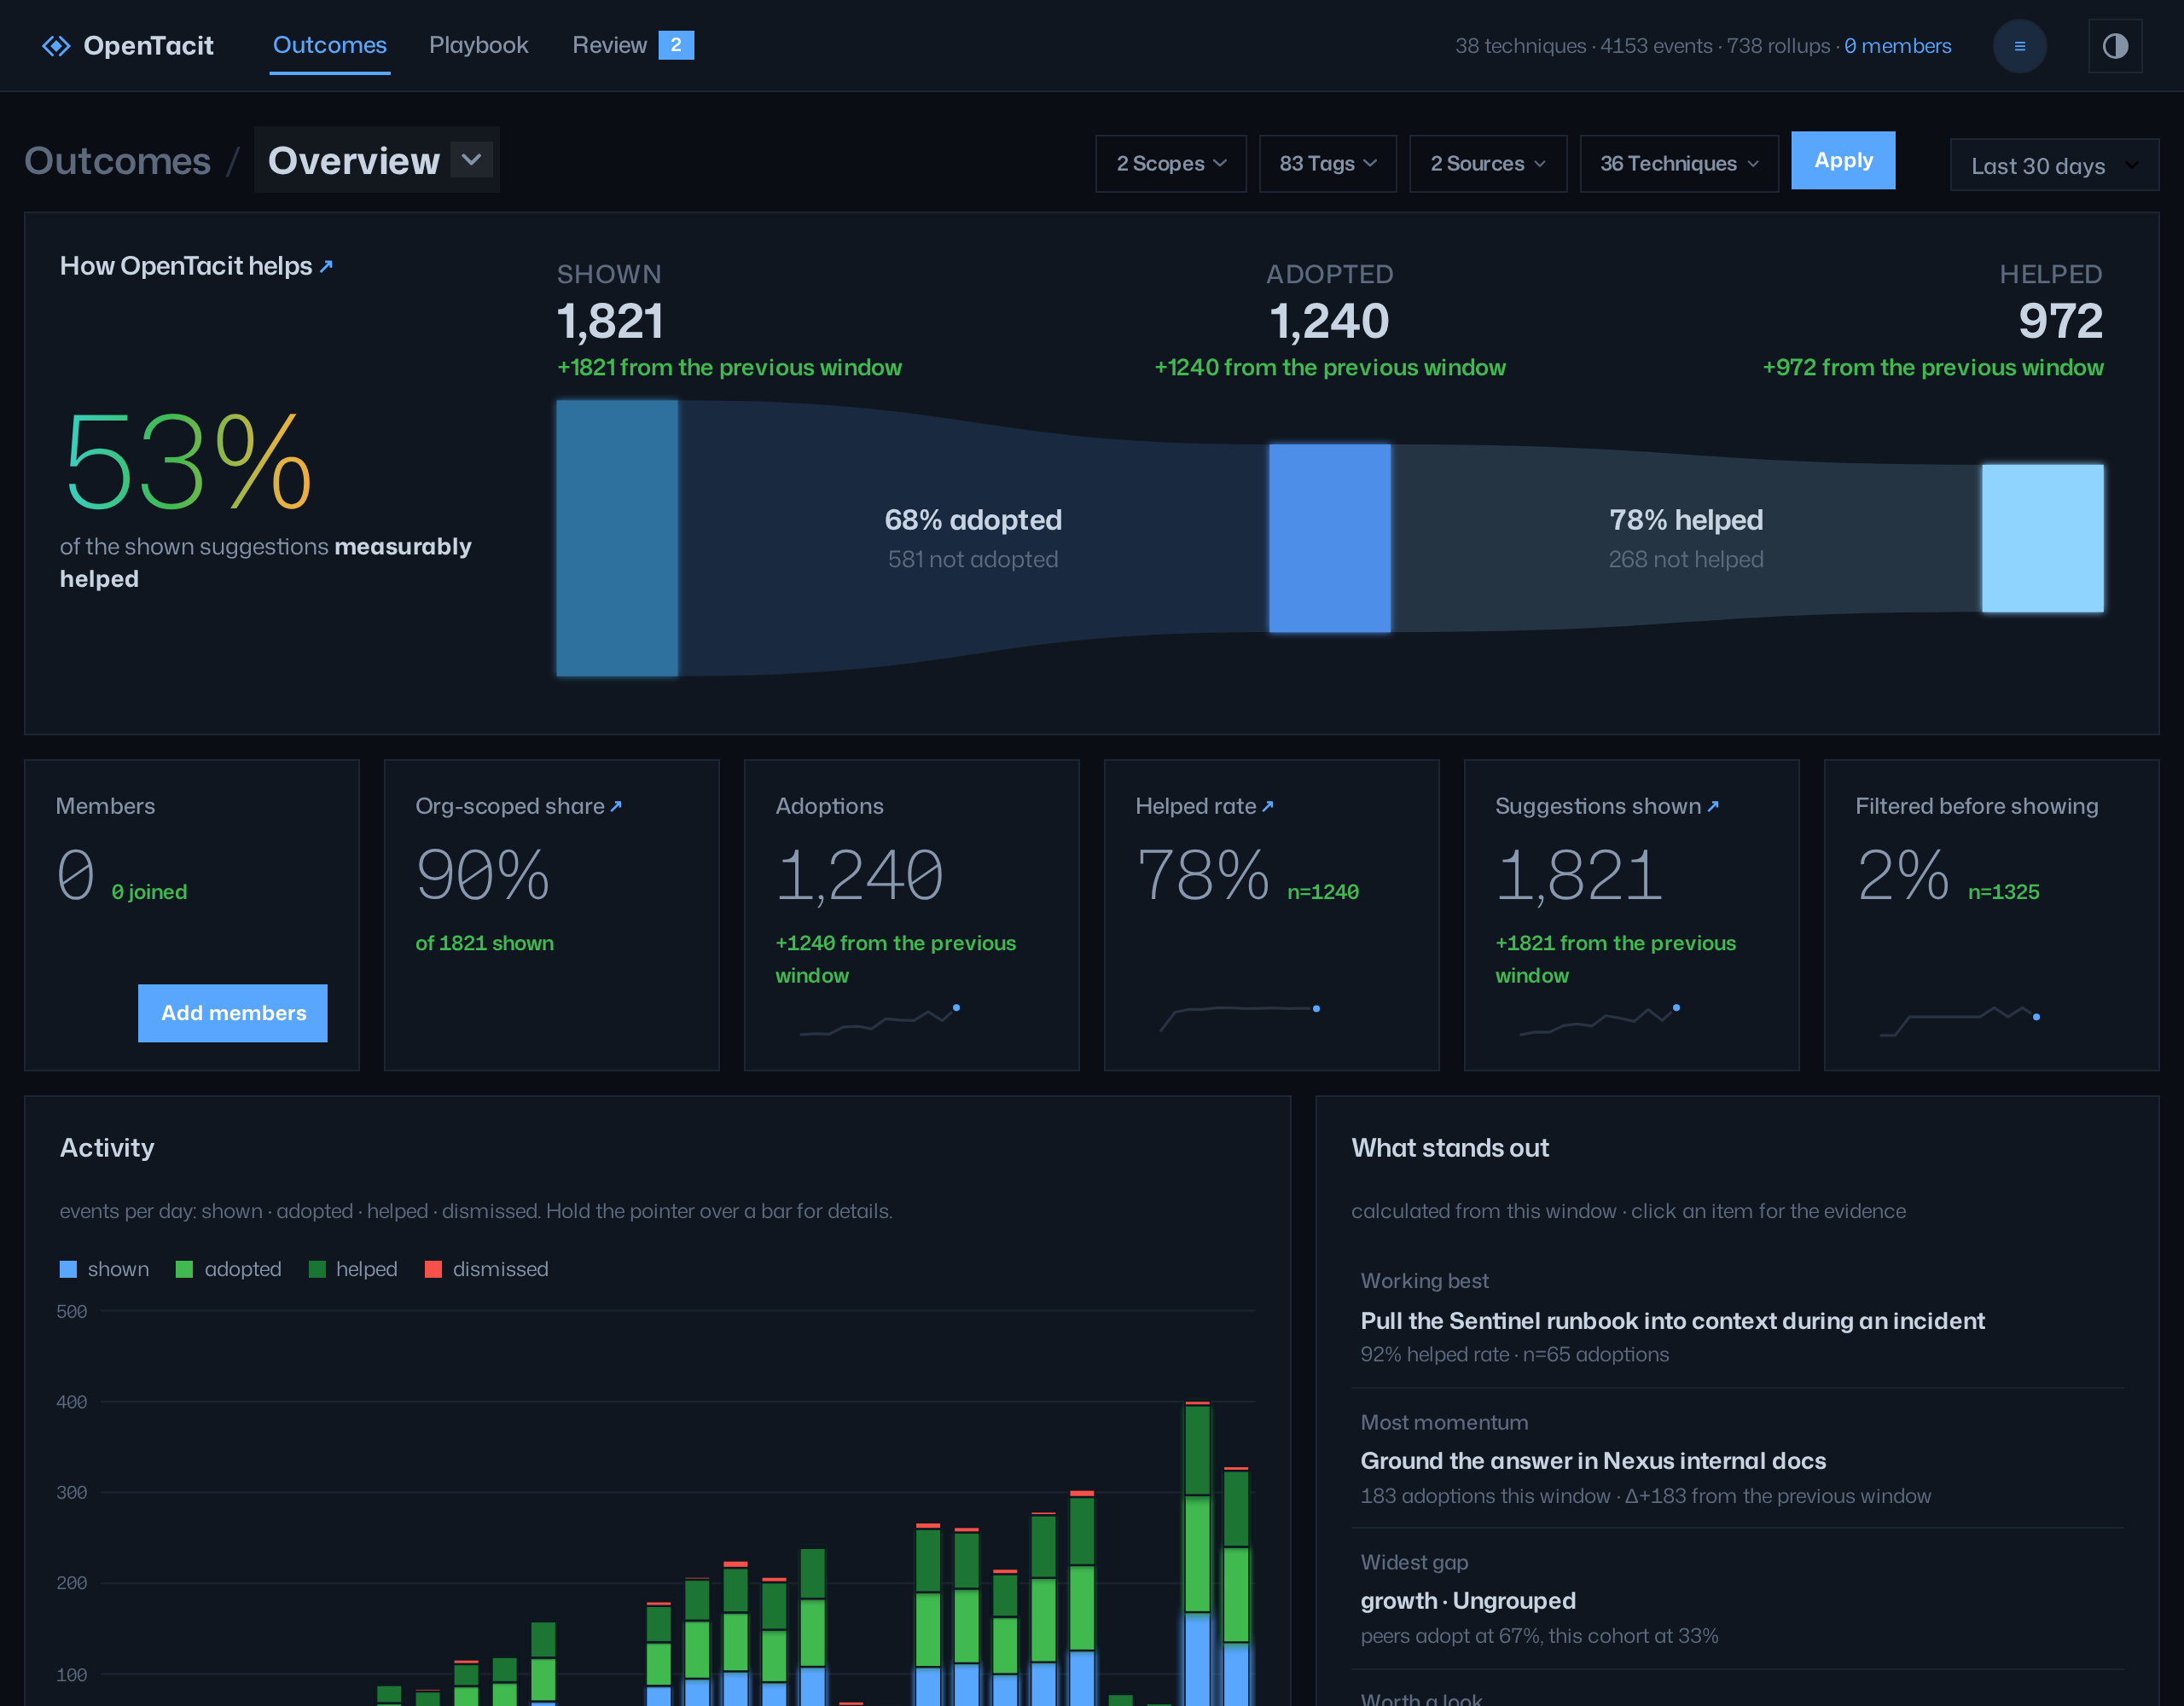
- Theme — the toggle in the top bar changes between the system, light, and dark themes.
Read the documentation in place
Click the account button. Then select Documentation. The registry serves its own documentation, and this guide is part of it. The documentation has the same search filter and navigation as the other dashboard pages.
Add it to your home screen
You can install the dashboard as an app. Use the install action or the add-to-home-screen action of your browser. The dashboard then opens in its own window with the ◆ mark of the registry.