Outcomes is the landing page of the dashboard. It answers the most important question: does the system help?
First, select a time window: Last 7, 30, or 90 days, or All time. Then use the filter bar to limit the page to specified scopes, tags, sources, or techniques. All panels on the page obey the window and the filters.
The funnel
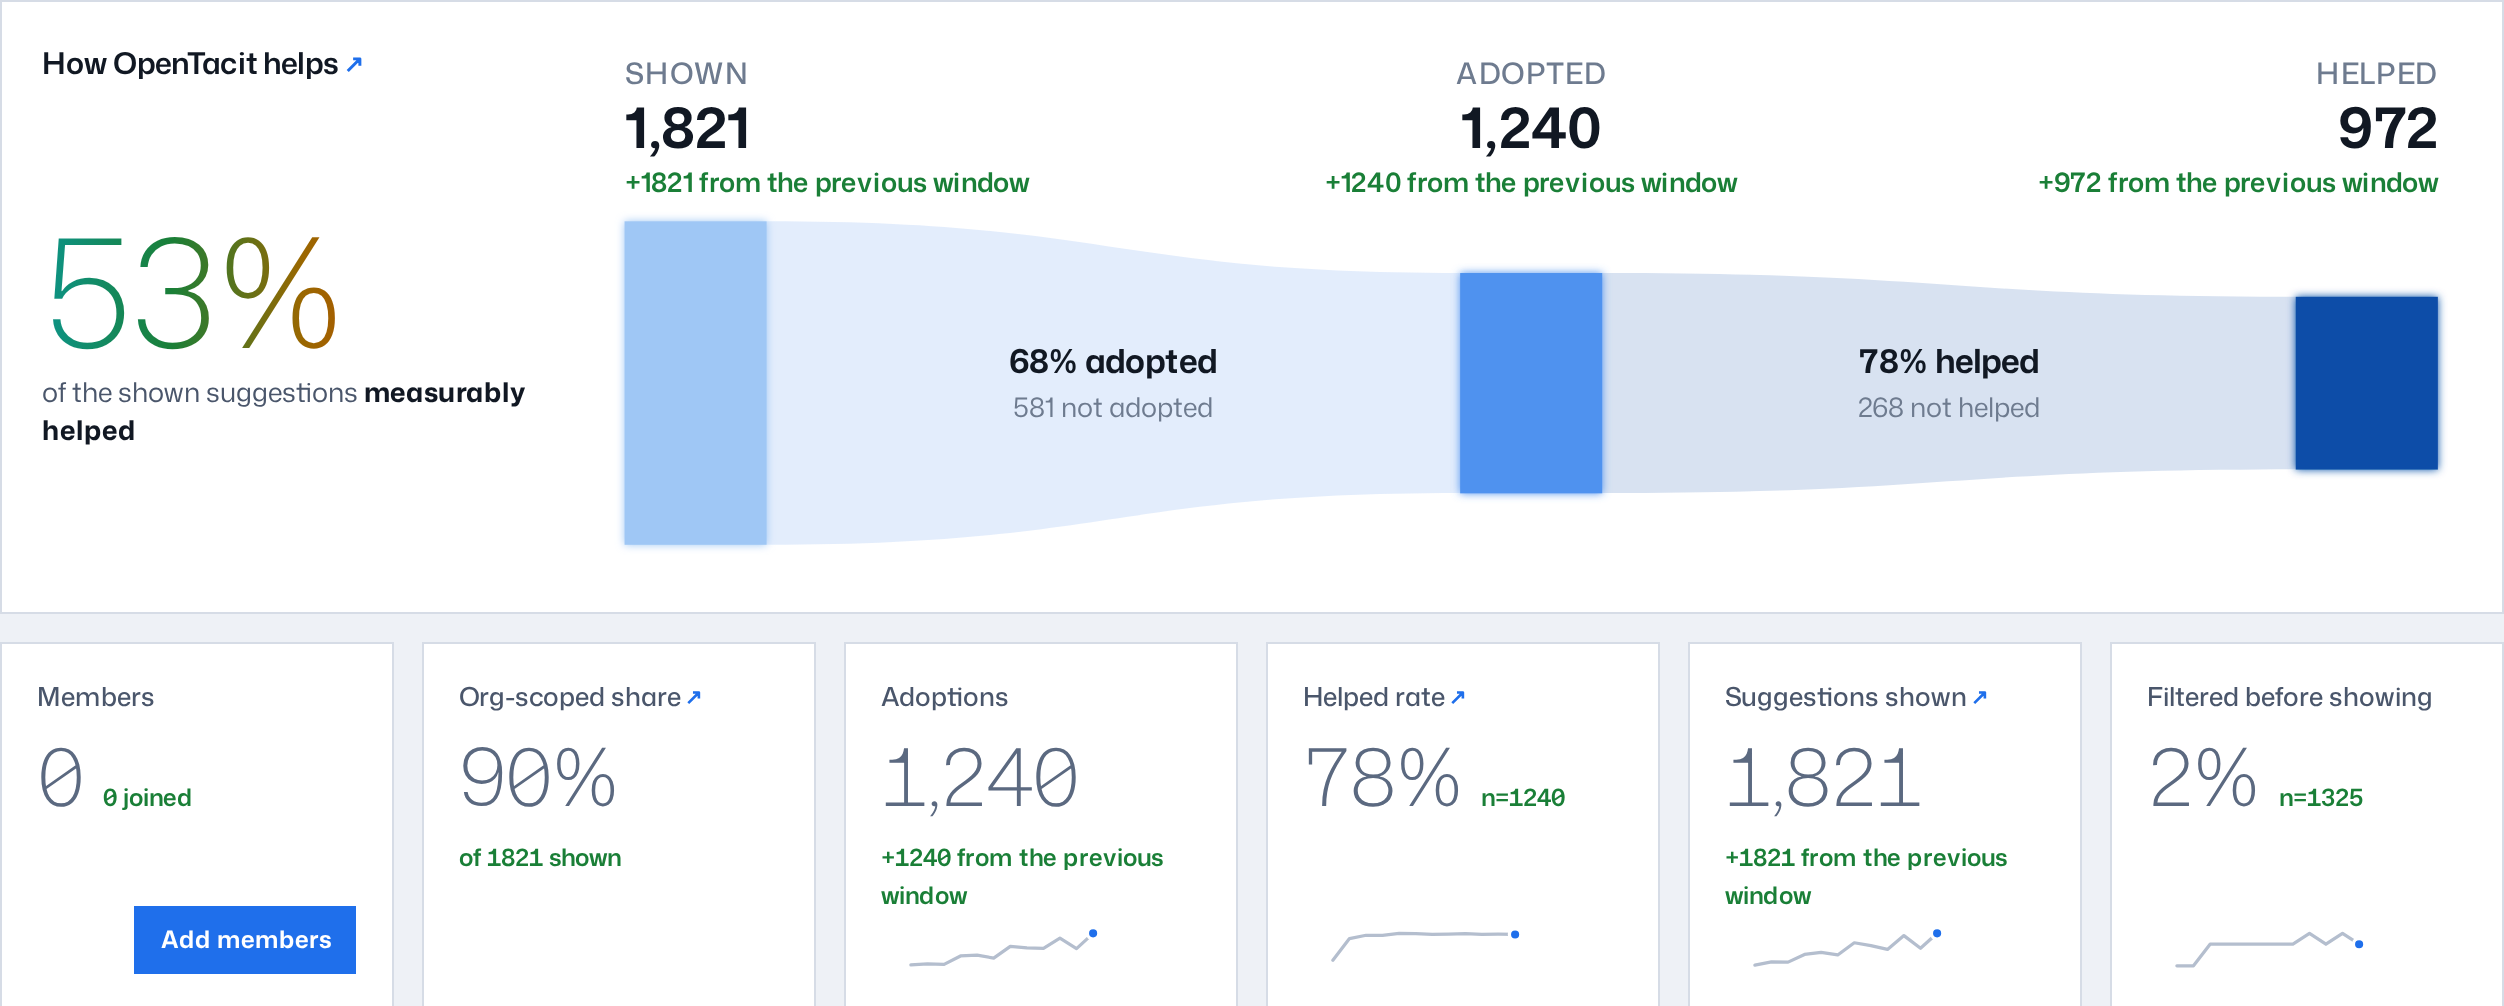
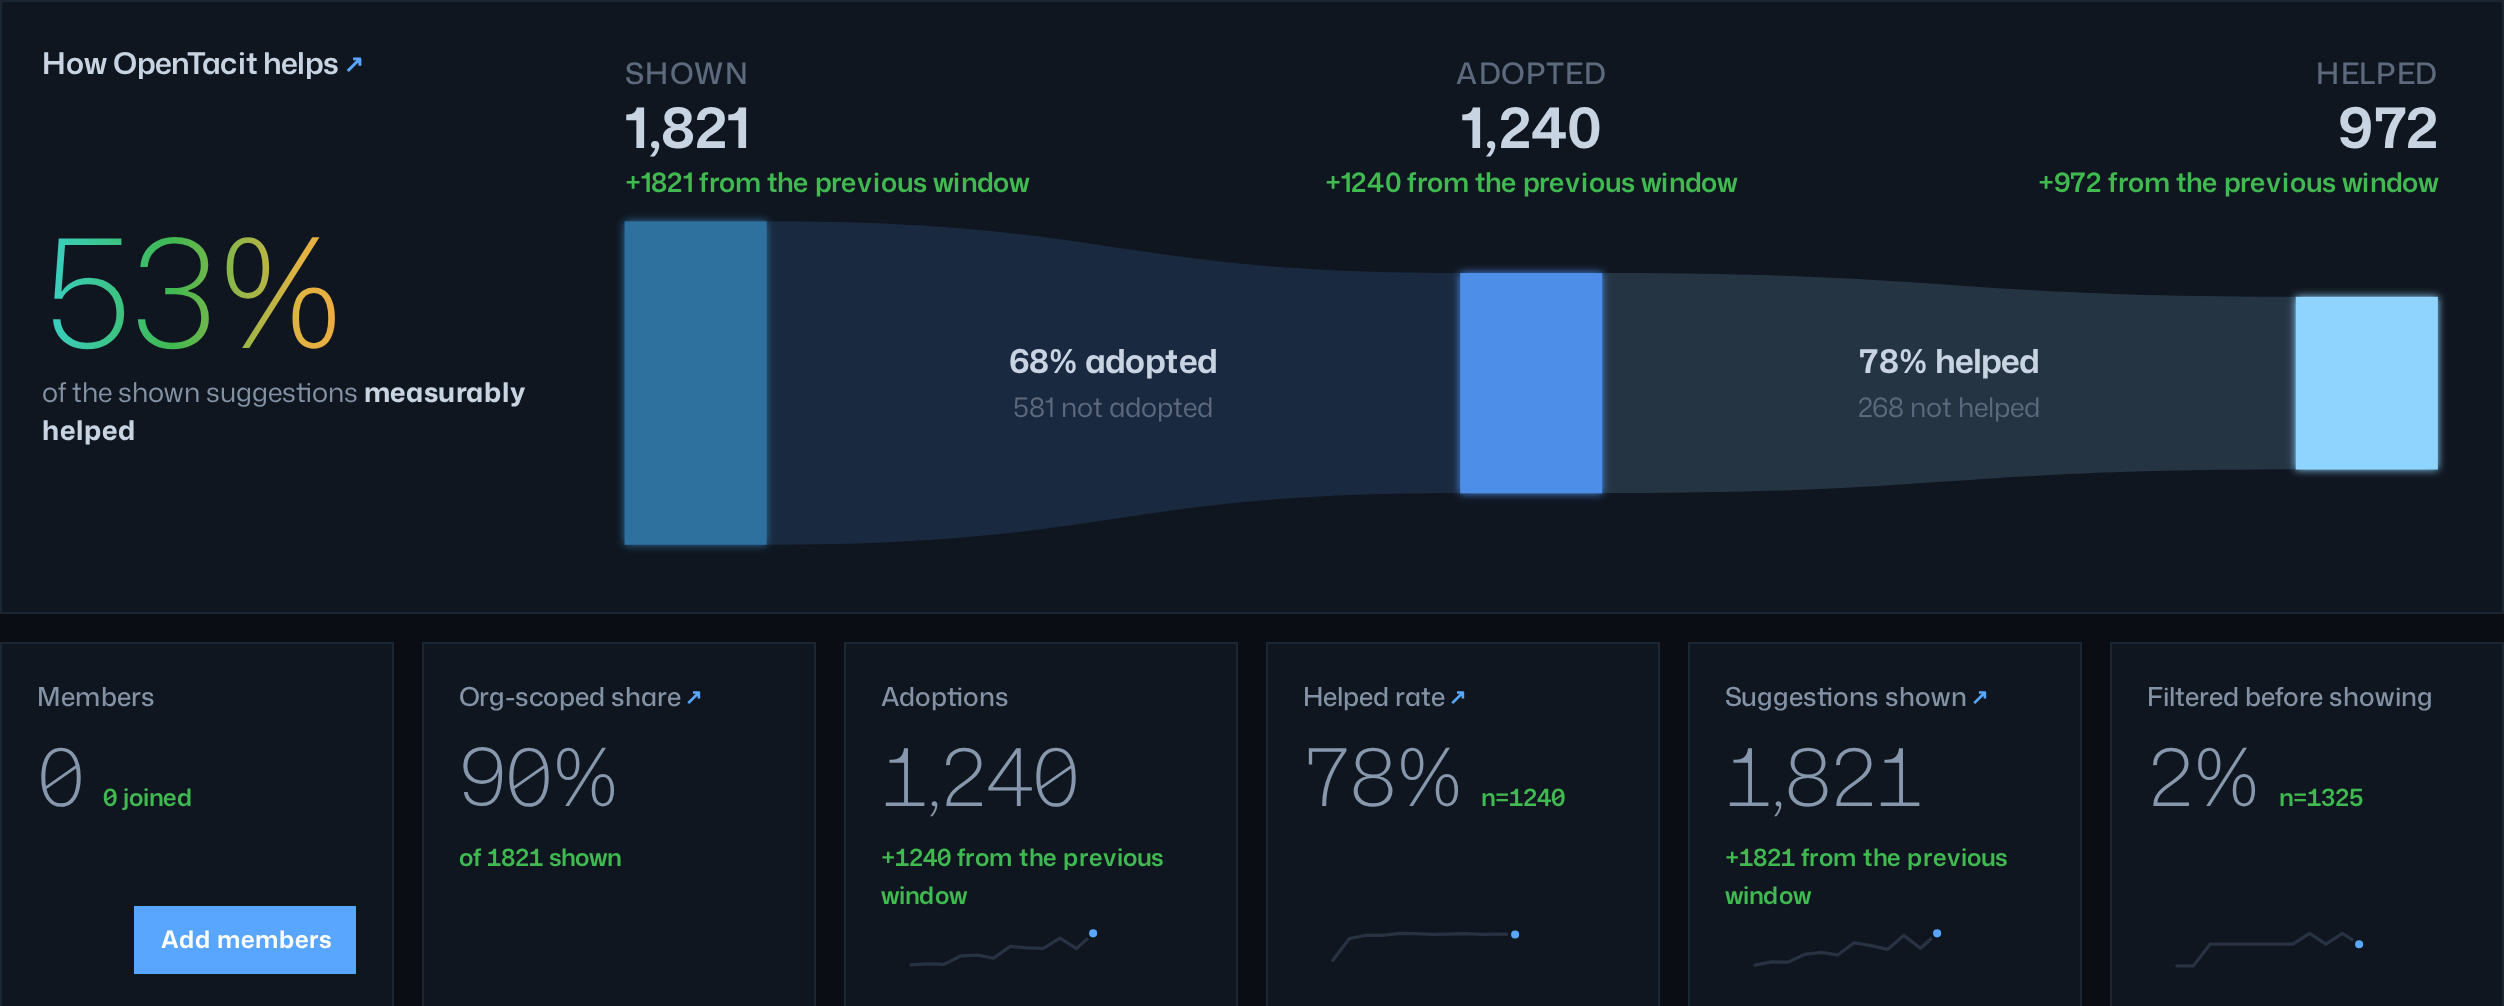
The main number shows the percentage of shown suggestions that gave measured help. The panel draws this as the shown → adopted → helped flow. It also shows the change from the previous window. Five pulse tiles are below the number. They monitor these values:
- Org-scoped share
- Adoptions
- Helped rate
- Suggestions shown
- Filtered before showing — the share of retrieved candidates that failed the fit check. These candidates got to no member. A lower value is better.
Click the panel to open the activity feed. The feed shows the events that are the source of the same numbers. "Shown" counts the techniques that a member saw. A playbook search with /tacit:search does not increase the count.
What stands out
Adjacent to the activity chart, OpenTacit shows the most important items. Each item links to its evidence:
- Working best — the technique with the strongest helped evidence
- Most momentum — the technique with the fastest increase in adoptions
- Widest gap — a cohort that is behind its peers on a technique that helps those peers
- Worth a look — a technique that shows decay or an important dismissal pattern
Leaderboards
The leaderboards show these lists:
- Most adoptions
- Highest helped rate — the list marks the organization average. Techniques with fewer than three adoptions get no rank.
- New activity
Click a technique to open its details.
Cohorts
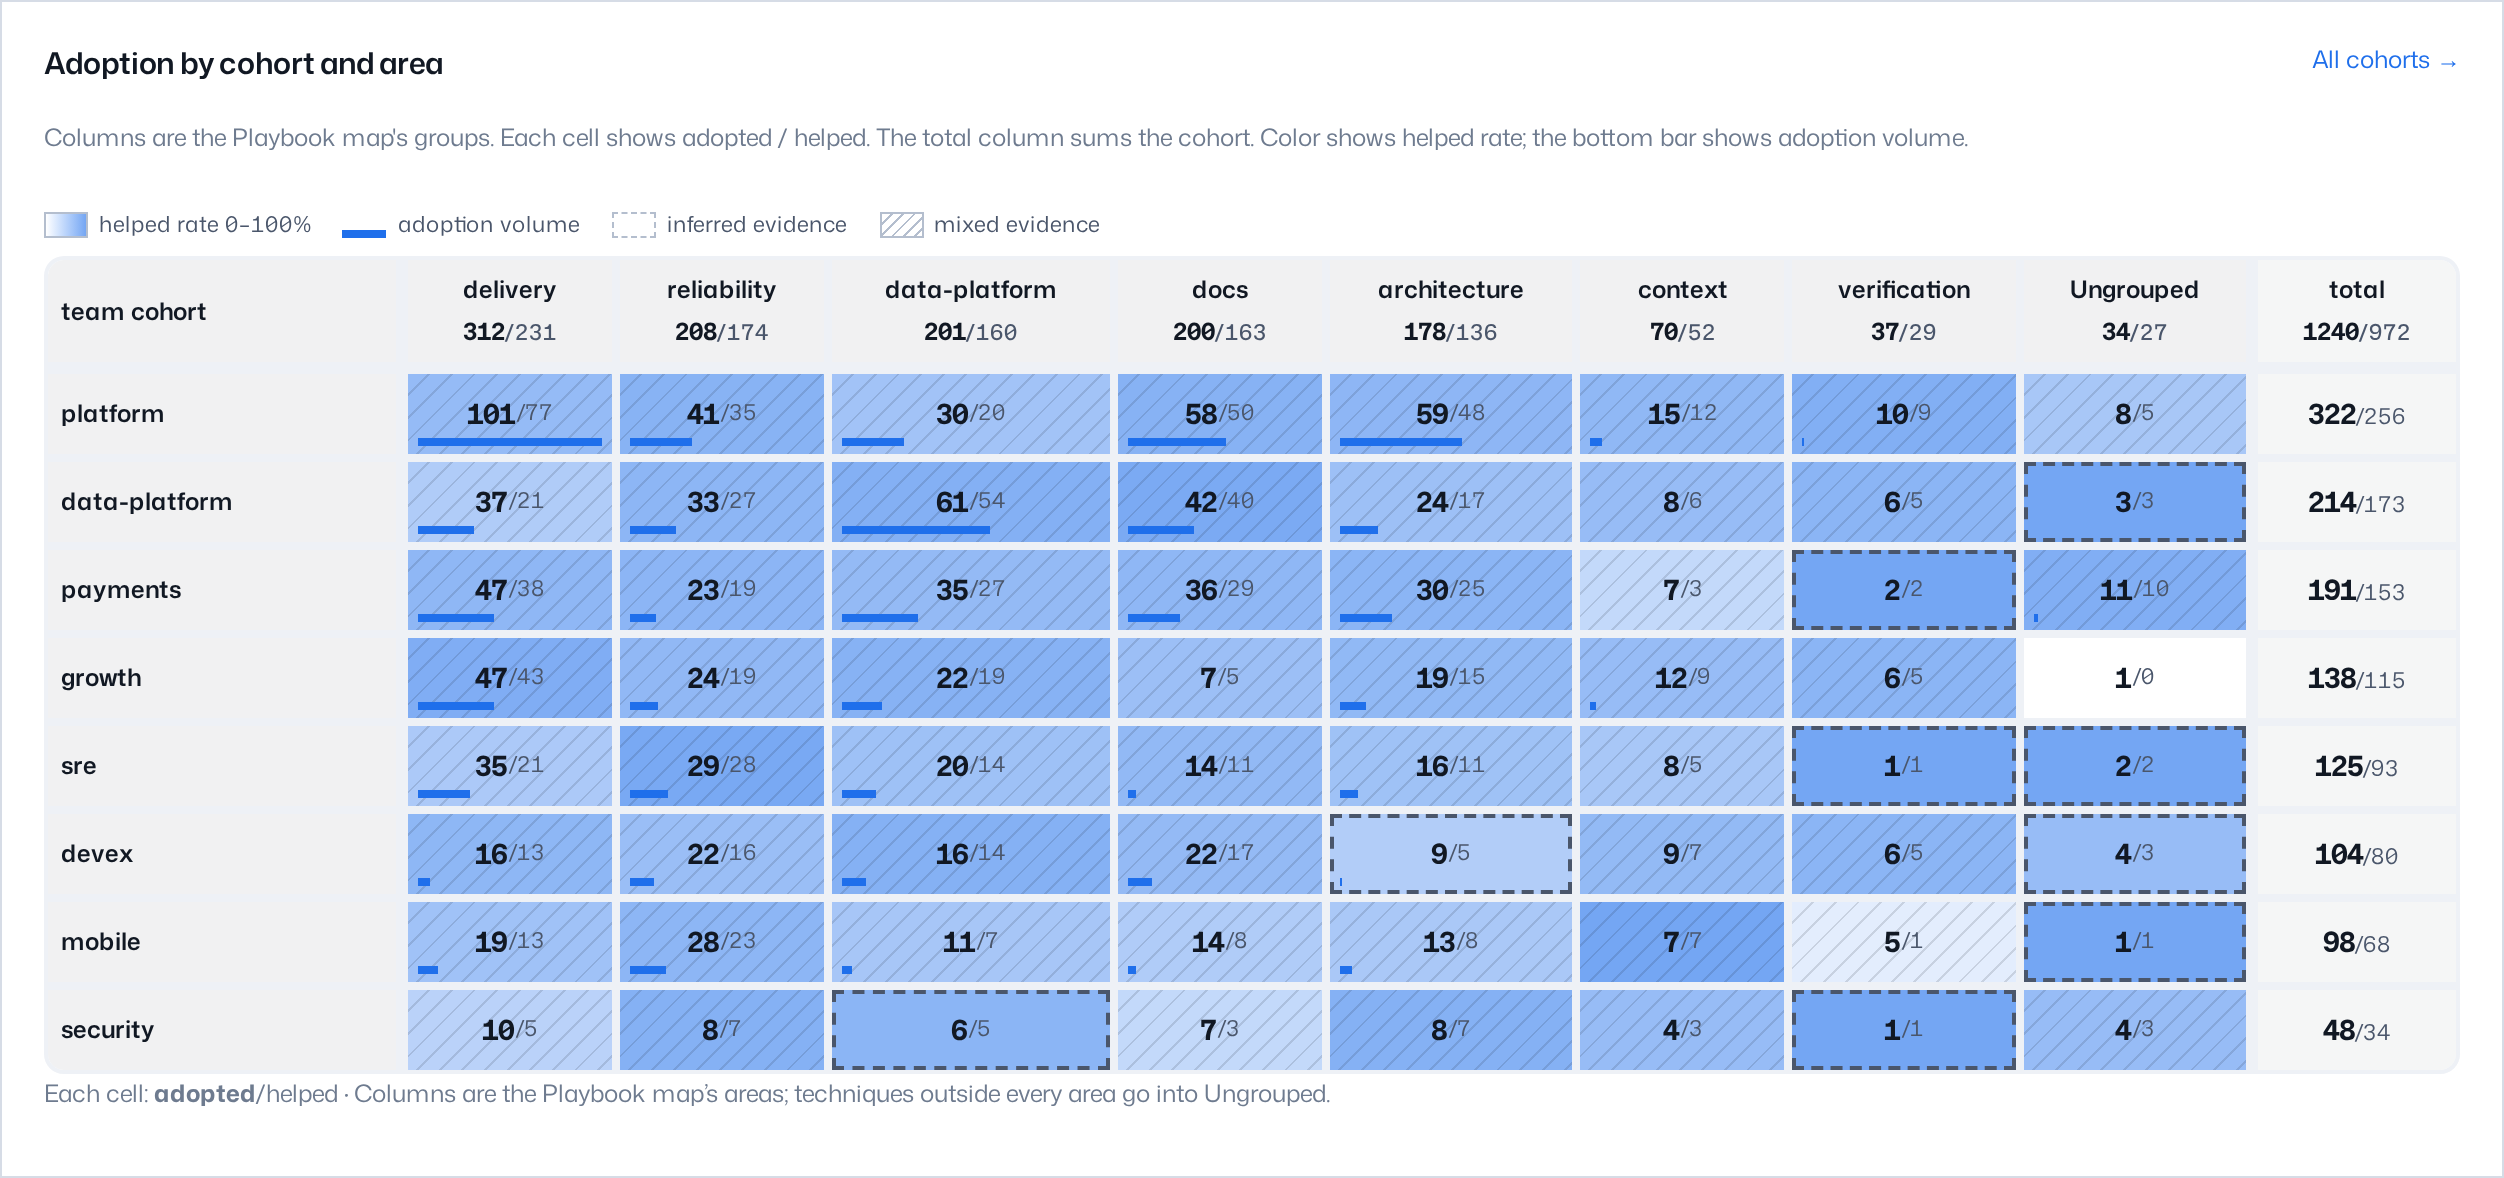
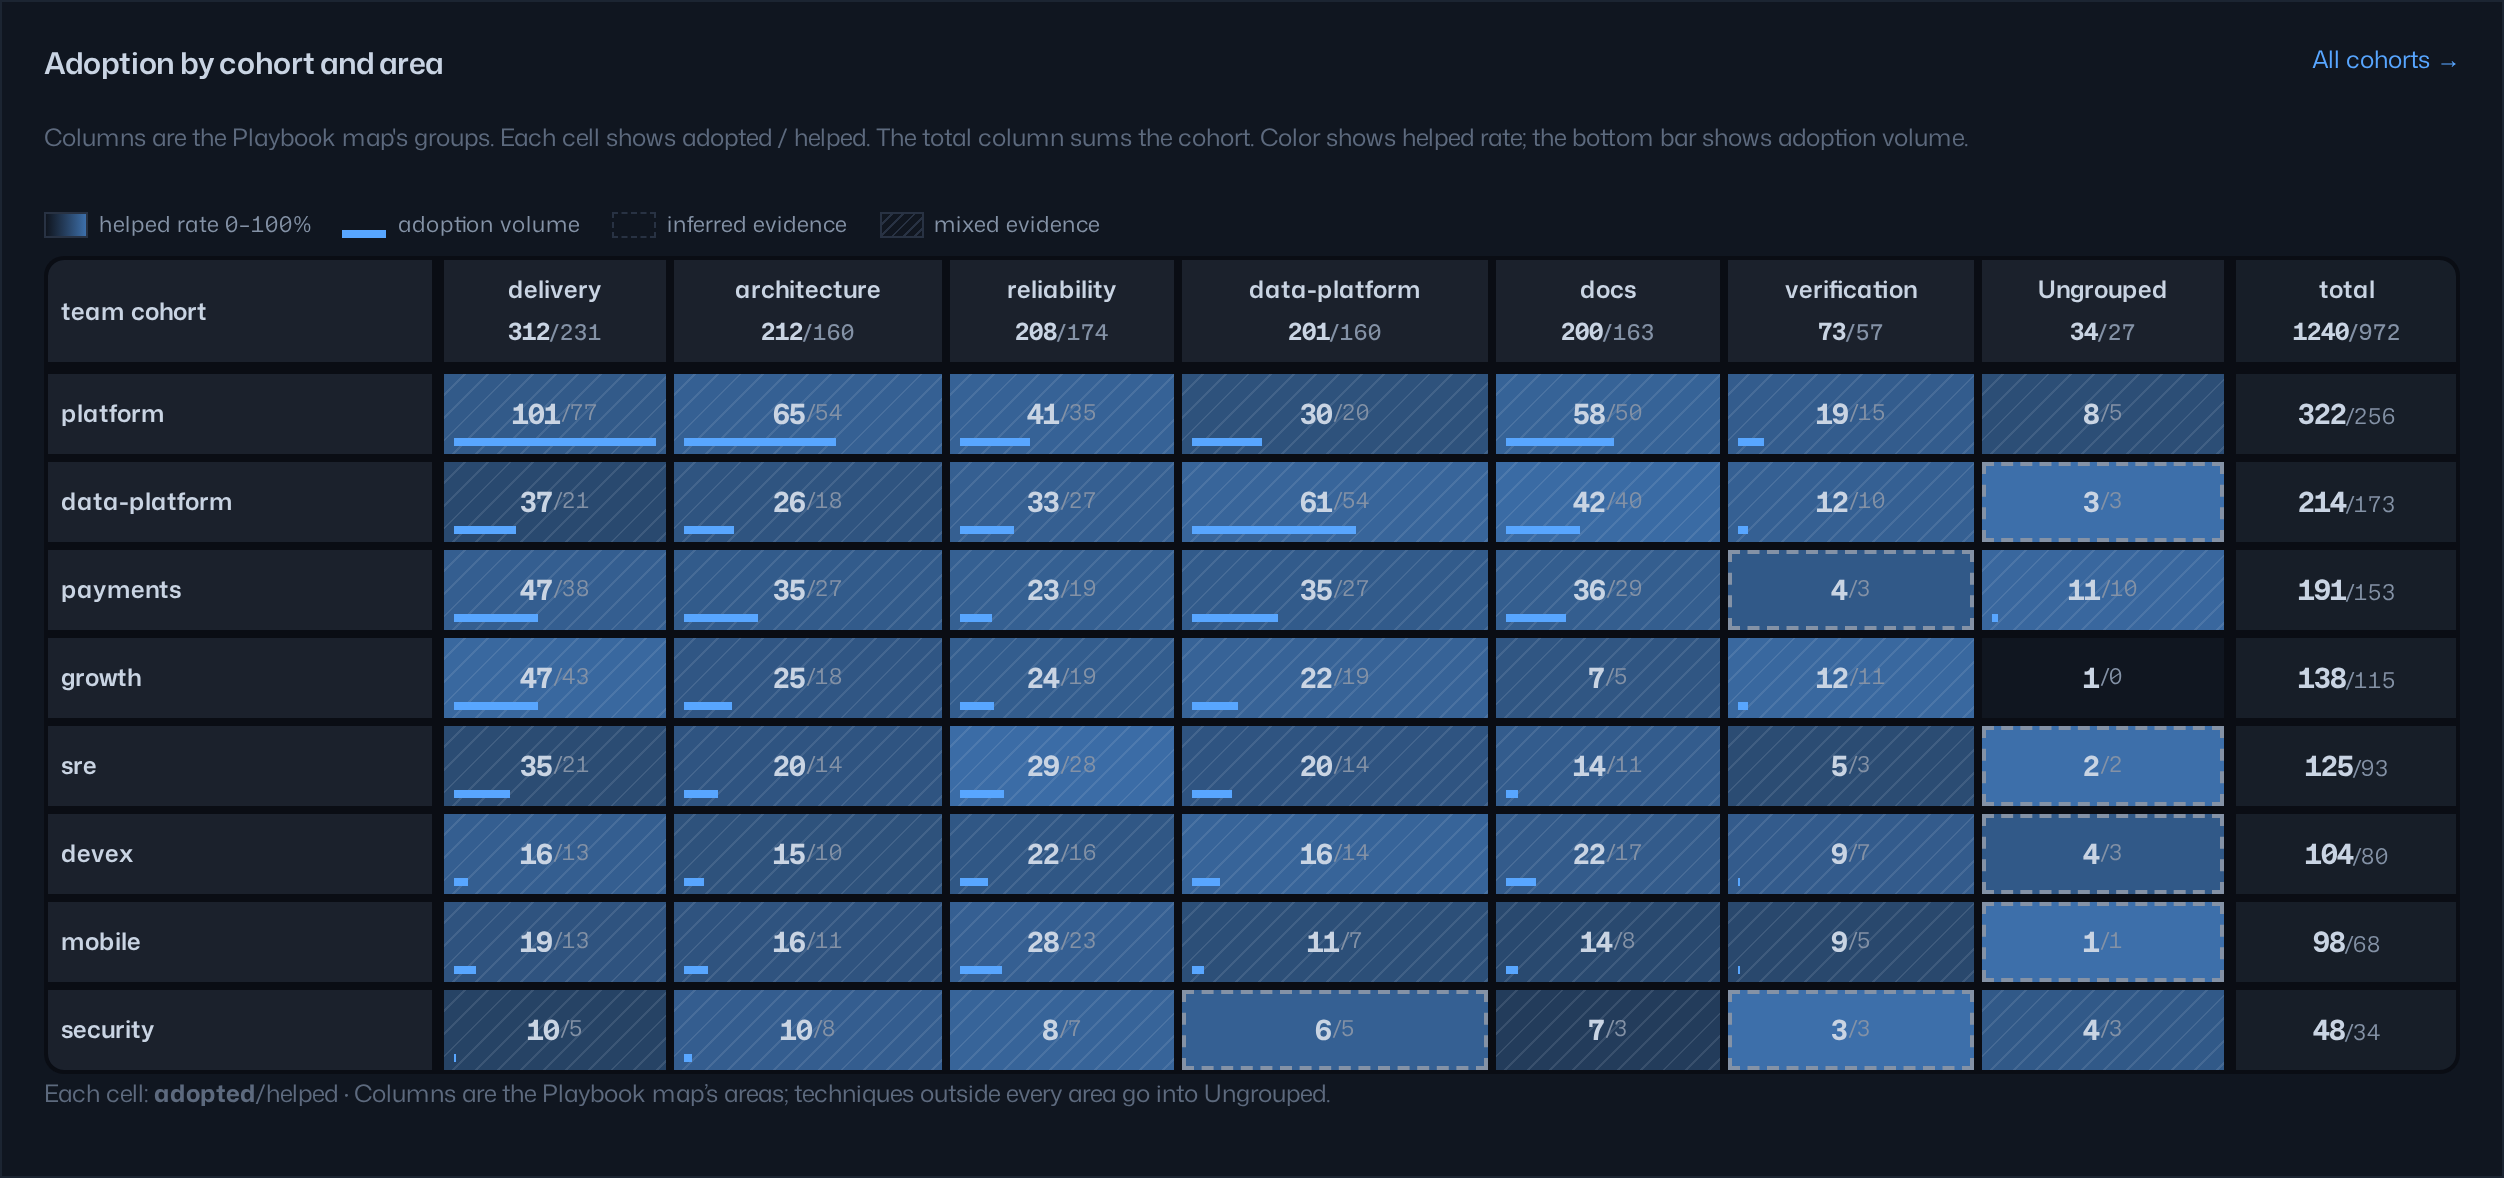
The adoption heatmap is a matrix of cohorts and areas of practice. The columns are the groups from the Playbook map. Thus the matrix and the map use the same names for the areas of the organization. Each cell shows the adopted count and the helped count. The color of a cell shows the helped rate. The Group by control changes the dimension: team, role, harness, or a different dimension that your organization reports. Click "All cohorts" to open the full cohort table. Click a cohort to open the funnel and activity detail of that cohort.
Knowledge mix and health
The last panels give data about the playbook itself. They show:
- The share of the playbook that is org-specific
- The sources of the techniques
- The distribution of dismissals across the reasons
- The calibration of inferred signals against explicit signals (signal trust)
- The health of the registry
The activity feed
The funnel shows the totals. The Events view shows the detail. It is a feed of OpenTacit activity, with the newest events first. To open the feed, use the view-switcher in the breadcrumb (Overview · Cohorts · Helped rate · Signal trust · Events), or click the funnel panel. The feed contains two types of events:
- Delivery — a technique event from one real interaction: shown, adopted, helped, or dismissed. Deliveries include the techniques that an agent applied automatically.
- Curation — a change that the playbook made to itself. Examples: OpenTacit found a technique in usage data, promoted a technique on its evidence, retired a technique, or flagged a technique for decay. Each event includes the reason.
A "By technique" table is at the top of the feed. It shows the funnel of each technique for the window. A cohort filter limits the feed to one cohort. The feed opens with a short list. Click Show more or Show all to see more events. The feed shows only cohort-level data, the same as all OpenTacit views. It contains no member identity and no session identity. The feed does not show evaluation telemetry by default. This telemetry includes the candidates that OpenTacit removed before a member saw them, and the shadow evaluations. Click Show evaluation telemetry to see it.
Drill-downs
The view-switcher in the breadcrumb moves between the views of the section: Overview, Cohorts, Helped rate, Signal trust, and Events. Each number on the page is also a link. The most useful destinations are:
| Page | What it shows |
|---|---|
| A technique's outcomes | All measurements for the technique: funnel tiles with sparklines, cumulative adoption, cohort spread, dismissal reasons, and the technique itself |
| Cohorts | The funnel of each cohort, compared with the organization baseline |
| Helped rate | The distribution of helped rates, and each measured technique in a list with the lowest rate first |
| Signal trust | Explicit feedback compared with inferred feedback, and the calibration gap for each technique |
| Events | The activity feed with the deliveries and the curation events of the playbook |
| Dismissals by reason | The techniques that members dismiss, and the importance of each reason |
| A tag, task type, or source | The combined funnel for that part of the playbook |
Read the numbers responsibly
Two rules keep the evidence correct:
- Be careful with small samples. A 100% helped rate from two adoptions has only two events as proof. For this reason, the leaderboards give no rank to techniques with few adoptions.
- Read the cohort views as locations where a proven technique can spread. Example: one team has a technique that a different team can use. Do not read the cohort views as ranks of persons. The registry does not know who did what. This is intentional.